Google Tag Manager: Tracking Form Submissions

Form Submission Tracking in GTM

As we know by now, Google Tag Manager is a very powerful tool that enables marketers and web developers to tag actions on a website in a single web-based interface. One of the most common actions that a marketer needs to tag is the submission of a form. Whether the form only collects email addresses for newsletter signups, or it is a multi-step form used for booking an appointment, Google Tag Manager can easily help you track submissions. Before you get started, here are some words to the wise:

  • Many forms are coded differently, so there is no one-size-fits-all solution for tracking them in GTM.

  • Be prepared for plenty of trial and error in Tag Assistant and your browser's developer tools.

  • Resist the temptation to build your trigger on "all form submissions" and clicks to the submit button.


Trigger-Building Scenarios to consider

As mentioned above, many forms are coded differently, and we'd need to use different triggers in order to cover different scenarios. When determining the proper trigger to use in order to track your form, be sure to ask yourself the below questions, and follow the handy flow-chart we put together

  1. Does the form consist of a proper <form> HTML element that generates a submit event?

    1. YES - use a Form Submission trigger

    2. NO - proceed to question 2.

  2. Does a successful form submission take the user to a thank you page, or is there a thank you message displayed on the same page?

    1. Thank you page - proceed to question 3

    2. Thank you message - use an Element Visibility trigger

  3. Is the thank you page shared by multiple forms on the site?

    1. YES - use a Page View trigger, but specify referrer page URL

    2. NO - use a Page View trigger. Referrer is not necessary in this case.

  4. Is the form an AJAX form (ask your developer)?

    1. YES - test an Element Visibility trigger, but if it does not work, you can install the AJAX listener code from Bounteous

    2. NO - proceed to question 5

  5. Does the form reside inside an <iframe> tag? **PLEASE GOD, NO!**

    1. YES - Work with the owner of the <iframe> to see if GTM or individual tracking tags can be placed or if a successful submission can be redirected to a non-iframe thank you page. If the latter is possible, return to question 3.

    2. NO - Work with developer to safely alter/remove any tags or scripts preventing a successful submission event from being sent to GTM.


This guide should help you figure out which is the appropriate trigger for tracking your form in most cases.

The below examples are for illustrative purposes only and are not necessarily websites we have worked on.

Scenario 1: Proper <form> element that generates submit event

This is the ideal situation. What would make this situation perfect is if the form element has a static, but unique ID attribute. If there is no ID, or the ID is randomly generated for each user, then it's best to use another variable or combination of variables. Class is an acceptable attribute to use if you are hoping to track multiple similar forms on your site, but do not need to track them independently from each other. Sometimes, certain CMS platforms or form builders create unique attributes for each form that can be captured as a custom variable in GTM.


This form has an id value of sales-form.


When building your Form Submit trigger, always filter and never use "all form submissions." Some tags (i.e. the Facebook pixel, other site code) send form submission events on every page load and would send false positives to whatever conversion tag uses said trigger.

In this example, we’d use a trigger where Form ID equals sales-form.

Trigger to use: Form Submit

Trigger fires when (depending on your specific scenario):

  • ID equals …

  • Class equals…

  • Class equals… AND Page Path equals…


Scenario 2: Unique thank you page URL

This is another good situation. For each form that gets submitted, the user gets redirected to a thank you page unique to that form. This is a simple trigger to build, and great if you need to track multiple forms separately from each other.


This is a clean solution, but if you have many different forms, each redirecting to a different thank you page, it can get a bit unruly to manage.


thank-you-page-trigger.png

Trigger to use: Page View

Trigger fires when (depending on your specific scenario):

  • Page Path or Page URL equals…

  • Page Path or Page URL equals… AND Referrer starts with…


Scenario 3: Shared thank you page URL

This is perhaps the simplest trigger to build, but beware - it may result in false positives if multiple different forms that need to be tracked separately redirect to the same thank you page. We had a client who has two different forms that represent two very different conversions. The first form always redirected users to a thank you page after a successful submission, and the second form would display a thank you message. Then one day, they began redirecting successful submissions of the second form to the same thank you page as the first form. Because they had originally built their trigger for all views of this thank you page, they were double-counting and recording lots of false positives for each conversion.


Trigger to use: Page View

Trigger fires when (depending on your specific scenario):

  • Page Path or Page URL equals…

  • Page Path or Page URL equals… AND Referrer starts with…


Scenario 4: Thank you message

Sometimes there are instances where a form submission does not send Google Tag Manager a gtm.formSubmit event, and it does not redirect to a thank you page, but a thank you message does appear. In this case, it would actually be ideal for you to work with your developer to have a custom event pushed to the data layer upon a successful form submission. If that is not possible, then we can sometimes build a trigger based upon when the thank you message shows up. We just have to find the element that the thank you message is contained within in order to build our trigger.

Some forms display a simple thank you message. We can use the element visibility trigger to detect a submission in this case.

The ID (starting with yui_3…) might change for each form submission in this particular CMS, so we will use the class (form-submisison-text) in this case.

We will use the CSS Selector method and call the form-submission-text class value by preceding it with a dot (.).

We will use the CSS Selector method and call the form-submission-text class value by preceding it with a dot (.).


Trigger to use: Element Visibility

Trigger fires when (depending on your specific scenario):

  • ID equals…

  • CSS Selector equals… AND Page Path equals


Scenario 5: Ajax form

The form displays a thank you message, but the element visible trigger isn't working. It's possible that this is an AJAX form. GTM still does not natively support AJAX form tracking, but Bounteous has created a great solution that is free for everyone to use. The code itself is highly technical, but you just need to copy & paste and follow a few steps as outlined on Analytics Mania's blog:


  1. Create a new blank HTML tag, and set it to fire on all pages

  2. In Tag Assistant, submit a form

  3. Look for the 'ajaxComplete' message on the left-hand side of Tag Assistant. If it's there, click on it. If not, then work with your developer to determine the best way to track this form.

  4. Click Data Layer

  5. Look for "response" inside the attributes node of the data layer

  6. Create a Variable

    1. Type = Data Layer variable

    2. Data Layer Variable Name = attributes.response

  7. Build your trigger


Trigger to use: Custom Event

Trigger fires when (depending on your specific scenario):

  • Event Name = ajaxComplete

    • Select "Some Custom Events"

    • attributes.response contains [success message above]


How do I QA my form trigger in GTM?

In Google Tag Manager, go to Tag Assistant by clicking the Preview button near the top-right of the interface. Then enter the URL of a page with the form that you would like to track in Tag Assistant, and then submit the form on the site. Did your tag show up in the “Tags Fired” section? If so, then your form trigger works. If not, then you may need to go back and review the above steps and try to refine your trigger. Always look at the variables tab in Tag Assistant for additional attributes to try to use in building your trigger. Also make sure that if your condition uses "equals," that your attribute appears exactly in GTM as it does in the site code.


tag-assistant-form-submit.png

If you need help with implementing form tracking or updating your entire Google Tag Manager container, don't hesitate to contact us via the chat or the form below. We do full GTM audits, implementations, and customizations.

UTM Paramaters: How to Build Tracking URLs with UTM Codes | Free URL Builder Tool Download

Measurement & Tracking Codes

Famous consultant and author Peter Drucker once said "If you can't measure it, you can't improve it." The great thing about digital marketing is that most activities are measurable, and thus can be optimized and improved in near real-time. How we go about measurement is through the wonder of tracking codes. The most common variation of the tracking code is the UTM parameter.


What are UTM parameters

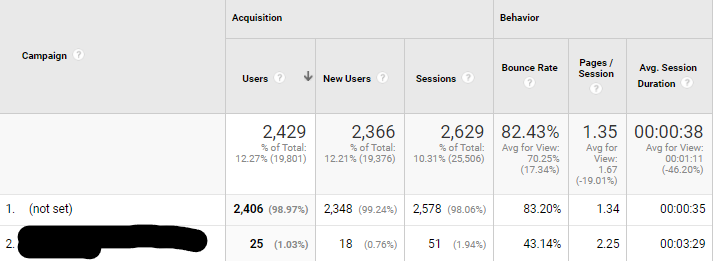
Have you ever looked in Google Analytics, only to see that a large portion of your traffic comes from the "Other" channel, or that your best-performing paid social campaign is "(not set)?" If so, then you need to start using UTM parameters like yesterday! UTM parameters, or UTM codes, are snippets of text appended to a URL that allow you attribute performance to specific segments of traffic. A segment of traffic can be as broad as an entire search engine (i.e. Google) or as narrow as a single keyword (i.e. baby shoes). These UTM parameters get added to the end of the URL and are ultimately read by Google Analytics and a number of other analytics systems and CRMs.

“Other” is the highest traffic-generating channel in this account.

Looks like the campaign name needs to be added to the URL for this paid social traffic.

Looks like the campaign name needs to be added to the URL for this paid social traffic.


How do UTM parameters work?

When appended to the end of a URL, the values in each UTM parameter are written to fields in Google Analytics that answer the question "where did this traffic come from?" Each UTM parameter (as does any URL parameter) follows the basic syntax parameter_name=value. The five UTM parameters are as follows:


Source (utm_source)

The originating source of the traffic. This is most commonly used to describe the website or channel that sent traffic to the URL that you are tracking. Some common examples of source values are google, facebook, bing, and cnn.com. At the end of the URL, the source will be sent in a parameter called utm_source.

Examples:

  • utm_source=facebook

  • utm_source=twitter

  • utm_source=google

  • utm_source=mailchimp


Medium (utm_medium)

The medium used to deliver the traffic. This is most commonly used to describe the grouping of websites that sent traffic to the URL that you are tracking. Some common examples of medium values are cpc, cpm, paid_social, referral, email. At the end of the URL, the medium will be sent in a parameter called utm_medium.

Examples:

  • utm_medium=cpc

  • utm_medium=paid_social

  • utm_medium=referral


Campaign (utm_campaign)

The name of the campaign or current initiative that this traffic is part of. This can be used either to describe a literal campaign in your paid search, paid social, or programmatic display account, or it can be used to describe a larger company initiative. How it is used should depend on the preference of whomever is the primary user of Google Analytics. If a paid search manager is the primary user of Google Analytics for his e-commerce account, then it's best for him to populate the campaign parameter with each paid search campaign name (i.e. Non-Brand_Shoes_Baby_Exact). If a marketing director is the primary user of Google Analytics, and she wants to get a high-level look at performance without getting too granular, then she may choose to populate the name of a current company initiative (i.e. Promo_Spring2021) in the campaign parameter. At the end of the URL, the campaign will be sent in a parameter called utm_campaign.

Examples:

  • utm_campaign=Non-Brand_Shoes_Baby_Exact

  • utm_campaign=Promo_Spring2021

  • utm_campaign=IG_SiteRetargeting


Content (utm_content)

A description of or identifier associated with an ad, email, newsletter link, video, or any content that may send traffic to the URL that you are tracking. This is a good place to put your email subject line or a specific button click within an email. When using Google Ads auto-tagging, Google automatically sends Headline 1 as the content value. If you're not using auto-tagging, you could have Google (or Bing) send the ad's ID to Google Analytics, and you can look up headlines and descriptions for each ad ID in a database or spreadsheet. There are many uses for the content parameter, so you'll have to determine what is best for you. At the end of the URL, the content will be sent in a parameter called utm_content.

Examples:

  • utm_content=March2021_50offSale

  • utm_content=tweet_how-to-fix-anything-with-duct-tape

  • utm_content=ad23438485871


Keyword (utm_term)

This parameter is used in paid search to show which keyword triggered the ad that was clicked on that brought the user to the URL that you're tracking.

Examples:

  • utm_term=lake%20house%20rental

  • utm_term=hockey%20mask

  • utm_term=chainsaw%20rental


Putting it all together

Each URL must follow the above syntax in order to function properly. Here is couple scenario that will help illustrate how to properly create a URL that attributes traffic to the UTM parameters that you set.


Scenario

You have a week-long 25% off seasonal promotion where you're driving traffic to a special promo page on mytotallyawesomesite.com primarily through email sent via Active Campaign and social media. You send two versions an email in order to A/B test subject lines, post once to Twitter, and post once to Facebook to support the promotion. In order to track how each of these activities performed, we would implement the following tracking URLs:

Email

  • Email 1: https://www.mytotallyawesomesite.com/25offpromo?utm_source=activecampaign&utm_medium=email&utm_campaign=Feb2021_25Off&utm_content=25Off_SaveBig

  •  Email 2: https://www.mytotallyawesomesite.com/25offpromo?utm_source=activecampaign&utm_medium=email&utm_campaign=Feb2021_25Off&utm_content=25Off_FOMO


Social

  • Twitter: https://www.mytotallyawesomesite.com/25offpromo?utm_source=twitter&utm_medium=social&utm_campaign=Feb2021_25Off&utm_content=25Off

  •  Facebook: https://www.mytotallyawesomesite.com/25offpromo?utm_source=facebook&utm_medium=social&utm_campaign=Feb2021_25Off&utm_content=25Off


Auto-tagging & dynamic UTM parameters are like bread & meat

If you are managing large, complex paid search or paid social campaigns, it is quite impractical to manage UTM parameters for tens of thousands of keywords and ads. Thankfully Google, Bing, and Facebook have solutions for this.


Google

Google has multiple ways to handle this.

  1. The gclid (Google click ID) is a unique identifier that stores information relative to the five UTM parameters and a lot more information. When enabled in your Google Ads account, it is automatically appended to the URL and read by Google Analytics without the use of UTM parameters. However, if you are using another tracking system that reads UTM parameters, it will not read the gclid. Sometimes if you're using a third-party management tool that uses redirect URLs, auto-tagging may not work. Check with your tool's own documentation on Google Ads auto-tagging to ensure compatibility.

  2. Tracking templates, + custom parameters + and Valuetrack dynamic parameters is a solution that allows you to put placeholders in URLs that get populated when a user clicks on your ad. For example, if I had utm_term={keyword} in my URL, and the keyword "dog sweaters" triggered my ad to show, whenever someone clicked on this ad they would see utm_term=dog%20sweaters show up in the URL. You can create what's known as a tracking template that dynamically fills in information for every single campaign, keyword in your account. If a particular parameter is missing from the list of available valuetrack items, you can assign a custom parameter to any campaign, ad group, ad, ad extension, or keyword in your account.

Bing

Bing uses tracking templates, custom parameters, and valuetrack parameters as well. Enabling auto-tagging automatically appends the below string to your URL:

utm_source=bing&utm_medium=cpc&utm_campaign={campaign}&utm_content={adgroup}&utm_term={keyword}


Facebook

Facebook has its own version of valuetrack which allows you to dynamically insert any of the following into your URL:

  • Source: {{site_source_name}}

    • This will be populated as fb for traffic delivered on Facebook, ig for traffic delivered on Instagram, and an for traffic delivered through the Audience Network.

  • Campaign: {{campaign.name}} OR {{campaign.id}}

  • Ad Set: {{adset.name}} OR {{adset.id}}

  • Ad: {{ad.name}} OR {{ad.id}}

When creating an ad, you can click "Build a URL parameter" and then enter any of these applicable values in the campaign source, campaign medium, campaign, and content fields in order to dynamically track your ads. Whatever you put here will be automatically replaced by Facebook when someone clicks on your ad.

facebook-utm-builder.gif


Caveats/words to the wise

Avoid the double question mark (?...?)

When building your tracking URLs with UTM parameters, always be aware if there is already a query string in the URL denoted by a question mark. If there is already a question mark, then begin adding your UTM parameters with an ampersand (&). For example:

Base URL: https://www.mytotallyawesomesite.com?id=2458

  • Wrong: https://www.mytotallyawesomesite.com?id=2458?utm_source=facebook&utm_medium=social&utm_campaign=spring2021

  • Correct: https://www.mytotallyawesomesite.com?id=2458&utm_source=facebook&utm_medium=social&utm_campaign=spring2021


Replace and encode characters ([space],|,&,/)

If you have an article named  "Top 5 Interview tips for Google/Amazon/Facebook," and you'd like to pass this title in the utm_content parameter, you would need to encode the string to replace spaces and the forward slashes. If you don't a number of undesirable things may take place:

  • The page may not load.

  • The page may load, but tracking parameters get cut off and fail to show up as desired in Google Analytics and other platforms.

A simple, yet awesome, free tool will do the encoding for you, so you don't need to memorize that %20 = space, etc. In order to encode your UTM value, input your string, and click encode. Next insert the encoded string in the utm_content parameter of your URL.

You can also use the ENCODEURL() function in Excel and Google Sheets to accomplish the same thing.

utms-encoded-decoded.png

Case matters

The values that appear in UTM parameters are case-sensitive. For example, utm_source=linkedin, utm_source=LinkedIn, and utm_source=linkedIn are read by Google Analytics as three different sources. Keep this in mind as you are creating your strategy for how you plan to track all of your campaigns and content.


Best practices when using UTM parameters

  • Before launching campaigns, determine your UTM naming convention, and stick to it. Make sure that anyone who creates a link also sticks to this naming convention.

How many of these Facebook source / medium combinations are the same?

How many of these Facebook source / medium combinations are the same?

  • Think about who needs to see these codes and how campaigns, mediums, and sources roll up into channels. Use this logic to make any necessary edits to your channel grouping rules in Google Analytics.

  • Use dynamic parameters and auto-tagging whenever possible.

  • For content and channels that do not allow you to use some form of auto-tagging or dynamic UTM parameter population, make sure that you lay out each URL along with its set of UTMs in a spreadsheet like this free tool we created for you to download. For any values that have spaces or any non alphanumeric characters (i.e. $,%,&,/), be sure to encode the string (our tool does this for you).

  • When sharing links on social media (especially Twitter), it's best to use a link shortener such as bit.ly. Some of the UTM creation tools such as Google's own tool actually have a link shortener built in or an integration with another tool that allows you to take your full URL with all UTMs intact and create a much shorter URL that redirects users to the your full URL.

google-utm-builder.png

  • Periodically review your traffic sources in Google Analytics, and make sure that any new sources and mediums are correctly mapped within your channel grouping rules.


Closing

In short, you absolutely should be using UTM parameters if you use Google Analytics and/or any other system that reads these codes. Without them, you run the risk of flying blind and not knowing which traffic is responsible for good and bad performance. If you need help creating and managing tracking URLs, download our free tool, and if you need help with your tracking and analytics strategy as a whole, don’t hesitate to contact us via the chat or the form down below.

Google Tag Manager: Tracking Button Clicks with GTM

Why track button clicks in Google Tag Manager?

Google Tag Manager is a very powerful tool, that enables marketers and web developers to tag actions on a website in a single web-based interface. Sometimes an action that a marketer needs to tag is as simple as clicks to a button. Depending on the site's business, a button click could be the main conversion action (i.e. an affiliate link) or it could be an engagement micro-conversion (i.e. open a video). In either case, a marketer would want to track a button, and thankfully Google Tag Manager makes it easy to do so.


How to track button clicks in Google Tag Manager

In order to track button clicks in Google Tag Manager, we need to create a trigger that fires whenever that button is clicked. How do we do that?

First we identify the button(s) you're looking to track. Then we right-click on the button and select inspect element. We’ll then see the html code associated with the button we clicked on.

This example does not have an id or class attribute, so we need to use other variables to properly track it.

In the code, find an attribute that is either unique to the single button that you're tracking or uniform across the many buttons that you're looking to track. If you're tracking a single button, it's best to use the id of the button if there is one, since id is an attribute that is unique to a single element on a page. If not, other characteristics may be used such as the text on the button in combination with the path or full URL of the page where the button resides. You can use Tag Assistant in order to verify that the elements you want to use are in fact correct. If you're tracking multiple similar buttons, it's best to use the class of these buttons if it is the same across these buttons, but not inclusive of other buttons that you don't want to track at this time. We are tracking a single button in this case, so we’ll use Click Text and Click URL in order to create our trigger.


In GTM, create a new trigger

Select the type Click - All Elements. Then select the "Some Clicks" radio button under This trigger fires on, and then select the firing condition. This particular trigger will fire on all clicks when the Click Text equals CONTACT US, and the Click URL contains #contact-form. Then name your trigger and save it.


Apply this trigger to a tag. You can add a blank HTML tag to your container and apply this trigger if you want to QA before sending false-positive data to GA or other platforms.

How do I QA my button click trigger?

In Google Tag Manager, go to Tag Assistant by clicking the Preview button near the top-right of the interface.

Then enter the URL of a page with your button in Tag Assistant, and then click on the button that you created the trigger for on your site. Did your tag show up in the “Tags Fired” section? If so, then your button click trigger works. If not, then you may need to go back to step 2 above and try another attribute. Also make sure that if your condition uses "equals," that your attribute appears exactly in GTM as it does in the site code.

Our blank tag has successfully fired.

Our blank tag has successfully fired.

If you need help with implementing click tracking or updating your entire Google Tag Manager container, don't hesitate to contact us via the chat or form below. We do full GTM audits, implementations, and customizations.

How to write CASE Statements

What is a CASE Statement?

Life is one big CASE statement! We are living in a series of conditions where if x = true then y happens. If I eat right and exercise, I will lose weight. If I drive to work, I will get there quicker than walking (unless you work from home). If you spend any time inside a database or a BI tool, the CASE statement will become one of your best friends.


By definition, a CASE statement is a function in most databases and BI tools that evaluates data against a set of conditions and produces a value based on the results of those conditions being true or false. The CASE statement is akin to the IF statement in spreadsheet tools like Excel and Google Sheets.


CASE statement syntax

The syntax of a CASE statement is below.  The statement must begin with the word CASE and terminate with the word END. Each condition begins with the word WHEN and is followed by the condition to be evaluated. Following the condition you have the word THEN and the result if that condition is true. Rinse and repeat as many times as necessary. Use ELSE to provide a catch-all or default value if no conditions are true.

CASE 
  WHEN [CONDITION 1]
    THEN {RESULT 1}
  WHEN [CONDITION 2]
    THEN {RESULT 2}
  ELSE {RESULT 3}     
END


Some examples of the syntax in action are below.

Metric example

CASE 
  WHEN `Clicks` = 0
    THEN 'No Clicks'
  WHEN `Clicks` >=1 AND `Clicks` <=10
    THEN '1 to 10 Clicks1
  ELSE '11+ Clicks'     
END

Dimension Example

CASE
  WHEN `Month` = 'June' OR `Month` = 'July' OR `Month` = 'August'
    THEN 'Summer'
  WHEN `Month` = 'March' OR `Month` = 'April' OR `Month` = 'May'
    THEN 'Spring'
  WHEN `Month` = 'September' OR `Month` = 'October' OR `Month` = 'November'
    THEN 'Autumn'
  WHEN `Month` = 'December' OR `Month` = 'January' OR `Month` = 'February'
    THEN ' Winter'
  ELSE 'Month Unknown'
END


Practical Applications of a CASE statement

If you're pulling data from Google Analytics into a Google Data Studio dashboard, you may want to create your own channel groupings if you haven't done so in Google Analytics. For simplicity's sake, let's say you want to create four channels + an "Other" channel for catching all unclassified traffic:

  • Search

  • Social

  • Email

  • Direct

  • Other


You could have a CASE statement that evaluates the source/medium in your Google Analytics data to produce a new channel field


CASE
  WHEN `source/medium` = 'google/cpc' OR `source/medium` = 'bing/cpc' OR `source/medium` = 'google/organic' OR `source/medium` = 'bing/organic'
    THEN 'Search'
  WHEN `source/medium` = 'facebook/cpc' OR `source/medium` = 'instagram/cpc' OR `source/medium` = 'twitter/cpc'
    THEN 'Social'
  WHEN `source/medium` = '%Hubspot%' 
    THEN 'Email'
  WHEN `source` = 'direct'
    THEN ' Direct'
  ELSE 'Other'
END

The CASE statement is your friend

CASE statements are not new, but if they're new to you, definitely try creating one in Google Data Studio, BigQuery, Domo, Tableau, or whatever platform you’re using. Do pay attention to the limitations and rules for whatever platform you happen to be using at the time. For example, Domo requires field names to be wrapped in tick marks (` … `), but BigQuery will let you get away with not placing the tick marks around the field names.

As always, if you have data, simple or complex, that requires CASE statements, don't hesitate to contact us for help.

Domo: An Introduction

What is Domo?

Domo is a powerful cloud-based solution that combines data integration & warehousing, business intelligence (BI), and application development in a single platform.


What data sources does Domo connect to?

Out of the box, Domo connects natively to many different cloud-based data sources. At the time of this writing, Domo has over 700 connectors built. Some of these are different connectors to the same parent data source, but this is still a lot of different data sources to connect to. Some examples are below:

Advertising & Marketing

  • Google Ads

  • Facebook Ads

  • YouTube

  • Criteo

  • AppNexus

  • Adobe Analytics

  • Google Analytics

  • Amazon Advertising

  • Snapchat Ads

  • Others

Databases

  • Amazon Redshift

  • Amazon Athena

  • MySQL

  • PostgreSQL

  • SAP

  • MongoDB

  • Snowflake

  • Vertica

  • Others

Structured Data Sources

  • CSV (upload or connect to HTTP/FTP/SFTP)

  • Excel (upload or FTP/SFTP)

  • JSON & XML (connect to HTTP)

Public Data Sources

  • Bureau of Labor Statistics

  • Bureau of Economic Analysis

  • OpenWeatherMap

  • Open Exchange Rates

  • NOAA

  • NHTSA

  • Others

CRM & Business Apps

  • Salesforce

  • Hubspot

  • Quickbooks

  • Freshbooks

  • ADP Workforce Now

  • Jira

  • NetSuite

  • SugarCRM

  • Box

  • Xero

  • Others


Domo can also connect to on-premise/local data sources through its proprietary Domo Workbench tool.

In addition to native and on-premise data connections, Domo has a developer platform that allows you to build a your own custom connector. This is helpful in cases where a particular Domo connector may not have the exact information you need, but said information is available via an API call.


Why is Domo great?

Sometimes when tools attempt to do a lot of things, they end up doing none of them that well. Domo is an exception to this rule. Your entire BI/Reporting/Analytics stack can live within Domo. The platform can be your one-stop shop for:

  1. Connecting to all of your data sources

  2. Storing that data that you've connected

  3. Preparing that data using MySQL, Redshift, or Domo's drag-and-drop "Magic ETL"

  4. Visualizing that data using one of over 150 different chart types or building your own custom visual or app

  5. Analyzing valuable data segments using custom filters, selectors, and drill-downs

  6. Detecting and communicating anomalies through Domo alerts

  7. Sharing reports and visuals through automated email or embedding in a web page or document


How do I get started?

Domo does have a free trial where you provide your contact information and then you're able to use the platform for a limited time.

There is a bit of a learning curve with the platform, but Domo has great training materials and guides to get you started with connecting, preparing, and visualizing your first dataset. The user community (known as The Dojo) is also a great resource for learning after you start using Domo.


What data can I visualize with Domo?

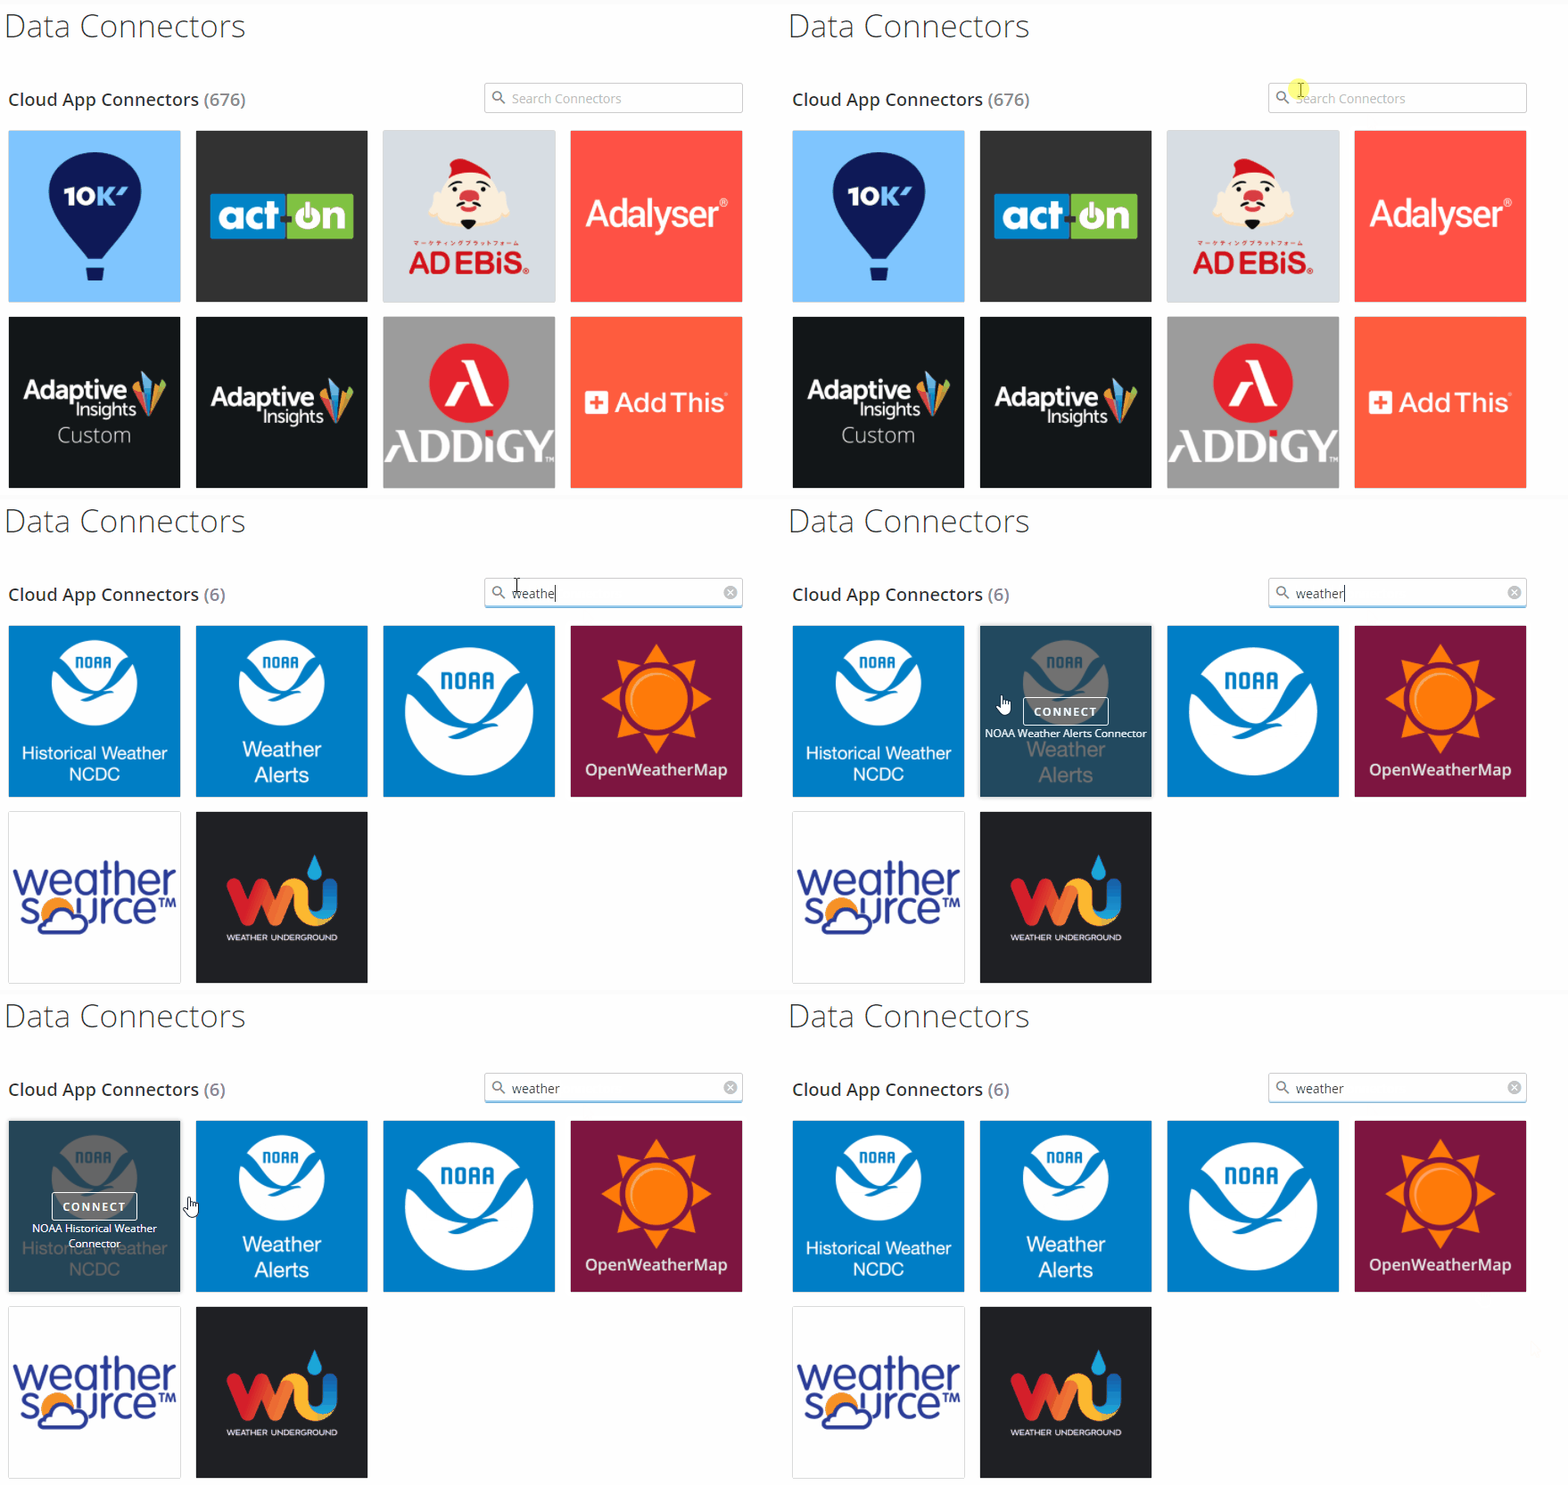
As mentioned above, you can connect to and visualize data from just about any data source you have. In addition, you can easily bring in public data to overlay with your business data. For example, if you sell rainwear, your business is likely impacted by the weather. You can easily connect to data via one of Domo's NOAA or OpenWeatherMap connectors.


Enrich your business data by bringing weather data into Domo

Enrich your business data by bringing weather data into Domo


You could then connect to your Google Analytics transaction data.

domo_googleanalytics_connectors.gif


What are some useful features?

Built-in ETL + Data Warehouse = One-stop Data Shop

The fact that Domo is a one-stop shop for your data needs is a useful feature in itself. This means that you don't have to build a huge stack with many different providers in order to move, visualize, and use your data. Domo's Magic ETL allows users to combine and process multiple complex data sources in order to produce a single dataset without writing a single line of code.

Magic ETL is where you can combine and clean data in one multi-step process.

Magic ETL is where you can combine and clean data in one multi-step process.


Calculated Fields (Beast Mode!!!)

Calculated fields is a pretty standard feature in all reporting and visualization tools, but Domo's Beast Mode is very powerful. It can handle re-aggregation of fields inside a nested CASE statement as well as some window functions typically only found in a SQL-based database environment. In 2020, Domo released the Beast Mode Manager which keeps all calculated fields in a single location within the user interface. This allows for ease of management of those fields so you do not have to be working inside a specific visual in order to create calculated fields. For example, if I need to calculate 10 different fields on my dataset I can easily do so before creating a single visual.

This is an actual Beast Mode calculation that is used to write a sentence that states “For every $1 in revenue that gets credited to PPC, another $X.XX influenced by PPC gets credited to another channel.”

This is an actual Beast Mode calculation that is used to write a sentence that states “For every $1 in revenue that gets credited to PPC, another $X.XX influenced by PPC gets credited to another channel.”


Drill-down

Domo allows you to drill down to view a particular data segment on just about any visual. For example, if you have a map visual displaying lead volume by US state, you could potentially click on Florida to see a map of leads by county or a bar chart displaying the number of leads driven per media channel. This is a completely customizable feature that often gets overlooked.


Alerts

In a true, enterprise-level BI platform, alerts is a must-have. Individuals or groups can be alerted if a metric:

  • changes by a certain percentage

  • Reaches a specific value

  • Is zero (useful in indicating data missing due to potential connection failure)

 Alerts can be sent via:

  • Email

  • Mobile push notification

  • Text message

  • Phone call

 Some practical applications of alerts:

  • Marketing launches a new digital ad, but that ad is not categorized - be alerted that you need to classify new entities

  • Website traffic drops by more than 20% in a given day - be alerted to negative SEO impacts from a recent Google update

  • Revenue drops to zero for a high-volume hour of the day - be alerted that you need to look into a potential problem with your Order Management System


Enterprise security

There are many security features within Domo that should remove fear of data getting into the wrong hands or viewed by the wrong people. Some of these features are below

  • Filter a dataset in order to restrict access for certain people to only see certain data on a shared dataset

  • Create access groups so that users can only see certain dashboards or filtered data on a shared dashboard

  • Single Sign-On & Open-ID Connect (SSO) compatibility

  • Enable multi-factor authentication

  • Restrict access by email address domain

  • Create & manage a whitelist for connected applications


Desktop software & plugins

Sometimes you need to email a report to someone within a specific template. Domo makes this super-easy through its Word, Excel, and PowerPoint plugins. For example, if you use the Word or PowerPoint plugin, you can add refreshable visuals to your templated document. If you use the Excel plugin, you can connect a spreadsheet to any dataset in your Domo instance and then download that data on demand.


Domo's Workbench software is a powerful and reliable solution for uploading data to Domo. Sometimes API connections fail, so you need a solution that will reliably and securely upload data from a server or personal machine to Domo, and Workbench does just that. You can use it to upload files from the following sources and formats to existing or new datasets:

  • Excel

  • CSV

  • JSON

  • Quickbooks

  • Database Query

  • SFTP/FTP file transfer

  • ODBC & OLEDB Connection

  • XML


Developer Platform & App Store

Many companies have utilized Domo's developer platform in order to create custom apps for both internal and commercial use. Some solutions built on the Domo developer platform include apps for measuring sales pipeline velocity, SAP order and vendor management, and contact center performance management. These solutions are available in the app store, but if none of these pre-built configurations meet your needs, you can generate a developer token and get started creating your own app and/or connector.


User Management & Activity Log

Domo's interface allows you to manage users access, group memberships, and permissions in a single location. Users can be imported in bulk which can be useful when managing hundreds or even thousands of users. In addition, admins can view and visualize user activity. This information is critical when getting people to adopt and engage with Domo so that you can talk with your users who rarely log in and have your frequent users become internal evangelists for the platform.


What are some limitations?

Steep Learning Curve

Domo is a great platform for centralizing and democratizing data, but it can be a bit daunting for new users. Old habits die hard, so there will be a challenge in getting some less-tech-savvy folks in your organization want to use the platform. It is best to have someone in the organization who is familiar with SQL and data structure in order to set the proper expectations and govern the instance accordingly.


Metric Comparison in Tables

For all that Domo does right, the lack of out-of-the-box metric comparison for some visuals can be frustrating. It is not currently possible to change time periods for metric comparison on the fly. For each metric in a table, you'd have to create a metric that is filtered to a specific date range (i.e. previous 7 days, last month, last year, two years ago, etc.), and disallow the user to select her own date range. When you have lots of metrics to look at and many different datasets, this can get very tedious very quickly.


Too Much/Never Enough

Some data connectors are mature, some are not fully baked, and others have multiple versions. In the latter case, it can require a lot of trial and error to find the correct connection that gets you the data you need.


Which Facebook connector will get me the data I need?

Which Facebook connector will get me the data I need?

Is Domo right for me?

If you're asking yourself this question, chances are that Domo is a solution worth evaluating. If any of the below statements apply to you, it's definitely worth at least a look:

  • I currently email spreadsheets back-and-forth

  • I handle millions of rows of data but do not have a large team/infrastructure already in place to handle data

  • I don't have any automated reporting solution in place

  • I have a BI/reporting solution in place, but we've outgrown it

  • I have data from multiple systems that need to be pulled, compiled, aggregated, visualized, and analyzed quicker than I can currently handle

  • I would like to automate my reporting, but don't know where to start

  • I would like to automate my reporting, and have a budget to do so


If any of the above are true, or if you tried Domo but got lost, Fusion75 can help. We are a Domo go-to-market partner and can help you get things set up quickly. Don't hesitate to fill out the form or contact us via chat!

Google Data Studio: An Introduction

What is it?

Google Data Studio is a free data visualization tool that allows users to build dashboards and easily share those dashboard with others.

What data sources does it connect to?

Out of the box, it connects natively to many different data sources

  • Google-Owned Products

    • Google Ads

    • Google Analytics

    • Google Sheets

    • YouTube

    • BigQuery

    • Google Campaign Manager

    • Google Ad Manager 360

    • Display & Video 360

    • Search Ads 360

    • Google Search Console

    • Google Cloud Storage

    • Google Cloud Spanner

  • Databases & File Uploads

    • MySQL

    • PostgreSQL

    • .CSV file upload

In addition to native connections, Google Data Studio has 200+ connectors developed and maintained by partners that allow you to connect directly to a number of sources including:

  • Facebook Ads

  • Facebook Page Insights

  • LinkedIn Ads

  • Microsoft Advertising (Bing Ads)

  • CallRail

  • AdRoll

  • Amazon MWS

  • AppNexus

  • Centro

  • Choozle

  • Constant Contact

  • Criteo

  • Hubspot

  • Quickbooks

  • And more

Why is it great?

Over the years, great data visualization and reporting automation tools have had high barriers to entry. Typically you'd need a large budget to cover not only the cost of a tool (or a whole stack of tools), but also the salary of the people maintaining it. In addition, it could take months or years to begin to see any value from your steep investment.

On the other hand, the cost of continuing to maintain large, complex spreadsheets is a cost that companies can ill-afford to keep paying. Sunk hours of downloading, copying & pasting, and updating vlookups for ad-hoc reports could be better spent using data to make decisions.

Google Data Studio is FREE. As long as you can supply the data, Google will let you visualize it in their tool for no additional cost. Also there is no cost to share your data with anyone who needs to see it.

Google Data Studio is familiar and highly customizable. Many other tools (paid & free) may offer a lot in terms of features and power, but you're stuck with a rigid template or have to be a coding wizard in order to get your dashboard to look the way you want. Rearranging and customizing the look and feel of your Google Data Studio dashboard is as simple as dragging, dropping, re-sizing, and changing fonts & colors as you would do in a PowerPoint (or Google Slides) presentation. On top of this, you can easily add drop-down filters and date range selectors for users to interact with the data on their own.

Re-arranging your report is as simple as drag-and-drop.

Re-arranging your report is as simple as drag-and-drop.

How do I get started?

Simply go to Google Data Studio, connect to a data source, and create a report.

create-report.gif


If you have any familiarity with Pivot Tables, or with tools such as Tableau, Domo, and Power BI, the interface should look similar.  You select your desired visuals, and then drag and drop fields until your visual accurately communicates your story.


What data can I visualize with it?

As mentioned above, you can connect to and visualize data from just about any data source you have. The Google products integrate seamlessly without much manipulation required, and then if data is prepped in an external database somewhere, it can easily be connected and visualized within Data Studio.

Need to display how many views your YouTube channel gets daily? Use the YouTube connector and create a trend line.

Need to know Cost per Conversion for each of your Google Ads campaigns? Use the Google Ads Connector and create a bar chart or table with those metrics.

Need to track spend vs. budget for your DV360 campaigns? Blend your DV360 data with your budget in a Google Sheet and use a Gantt chart from the community visualization library.

Have a mobile app powered by a PostgreSQL database? Use the PostgreSQL connector and create a map showing what states or countries your new users are coming from.

The bottom line, is that as long as you supply the data and structure it properly, Google Data Studio can help you visualize it.


What are some useful features?

Sharing and embedding

All reports created in Google Data Studio can be shared in the same way that any user can share a Google Doc or Google Sheet. Simply click the +Share button, and select whom you are sharing the report with. You can also make any report accessible to anyone who has the link.

All reports can be embedded on another site or in an internal web application.

We've created a client-facing report for a company who provides information to clients behind a secure login.

Calculated Fields

This one is a pretty standard feature in all reporting and visualization tools, but Google Data Studio keeps all fields (calculated and non-calculated) in a single location on the dataset. This allows for ease of management of those fields. For example, if I need to calculate 10 different fields on my dataset I can easily do so before creating a single visual.

Creating a calculated field is simple in Google Data Studio

Creating a calculated field is simple in Google Data Studio

Drill-down

Google Data Studio allows you to drill down to view a particular data segment on just about any visual. For example, if you have a table with performance grouped by week, you could potentially drill down to see data by date for a particular week or data by date for all weeks in the table.

Drill down from week to date, category to sub-category, etc.

Drill down from week to date, category to sub-category, etc.

Row-level security

This is an enterprise-level feature hiding inside a FREE tool. You may have a dataset that contains data for multiple clients, but you only want client A to see client A's data. By adding a field containing client A's email address on client A's data, if client A is logged into her Google account with that same email address, she can only see her data. If she's not logged in, she will not see any data.

Include a client’s email address in your dataset in order to maintain security while achieving scalability.

Include a client’s email address in your dataset in order to maintain security while achieving scalability.

We actually utilized this feature on the same embedded report mentioned above so that multiple clients could access the same report but still only see their own data.

Metric comparison

In 2020, some PAID tools still do not offer an easy way to do metric comparisons out of the box. If I wanted to create a table showing this month's data and then show the percent change vs. the previous month, I'd have to create a bunch of CASE statements and not allow for changing date ranges, etc. Google Data Studio absolutely knocks this out of the park. We can simply select "Previous period" from a drop-down menu, and BAM! You can even get fancy and choose to not compare certain metrics within your table.

Comparing metrics over time is simple.

Comparing metrics over time is simple.

Change your date range, and see that both the metric and the comparison numbers change.

Change your date range, and see that both the metric and the comparison numbers change.


Community Visuals

A number of third parties have created cool and useful visuals that live outside the realm of what Google has already created for us. Gantt charts, sunbursts, metric gauges, radar charts, and more already exist and can be added to any report you create, and if you don't see what you need, you can develop it yourself!


community-visuals.png


What are some limitations?

ETL not Included

Google Data Studio is solely for visualization. It does not include an ETL tool to prep your data, so if you're combining data from multiple sources (i.e. Google Ads, Facebook Ads, and Google Analytics) into a single dataset, you'll need to do your data prep work elsewhere. While this in itself is not a bad thing, it is noteworthy for expectation setting.

Fusion75 uses tools such as Xplenty and BigQuery for prepping data prior to visualizing it in Google Data Studio.

Alerts missing

While Google Data Studio is awesome for reporting and visualization, it falls short of being a full-fledged business intelligence tool. For example, a platform like Domo can proactively send alerts stakeholders via email, text message, and push notification if a particular metric changes by a certain percentage.

Drill-down customization

This one is nuanced and may not be a big deal for the vast majority of users, but when drilling down on a visual, you cannot drill down to another type of visual. For example, if I wanted to click on a single week in a table, and have the resulting drill-down be a pie chart breaking down traffic by device type, I would not be able to do so. I can only drill down to another field within that same table.

Manual Refresh

There is no real-time auto-refresh. This one is not a huge deal, because the manual refresh is one click, but if you're dealing with real-time data, you may not want to have to keep clicking the refresh button. Some third-party developers have developed an auto-refresh solution that refreshes the report on user-defined intervals (i.e. 5 seconds, 1 minute, etc.), but these solutions are not maintained by Google and could potentially stop working after a platform update.

CASE Statement limitations

With calculated fields, you cannot include a function or reference an aggregated field inside your CASE statement. Some paid platforms allow you to do this, but Google Data Studio does not. You can, however, create a non-aggregated function and reference that field within a CASE statement, but there is no solution for aggregating a metric within the WHEN clause of a CASE statement.

Is Google Data Studio right for me?

If you're asking yourself this question, chances are that Google Data Studio is a solution worth trying out. If any of the below statements apply to you, it's definitely worth at least a look:

  • I currently email spreadsheets back-and-forth with clients and/or my internal team.

  • I don't have any automated reporting solution in place.

  • I have a reporting solution in place, but it's very rigid and reporting views are not able to be customized.

  • I like Google Drive/Docs products and wouldn't mind a user interface similar to those interfaces.

  • I would like to automate my reporting, but don't know where to start.

  • I would like to automate my reporting, but don't have an enterprise budget.

If any of the above are true, or if you tried Google Data Studio but got lost, Fusion75 can help. Don't hesitate to contact us!

What is Call Tracking?

Call Tracking Defined

Call tracking is the technology that assigns unique phone numbers to ads, campaigns, keywords, and marketing channels in order to enable marketers to measure the effectiveness of their inbound marketing campaigns.
Unique Tracking Numbers

If you've ever seen the same commercial on two different TV channels or two different commercials on the same channel advertising the exact same product, there's a good chance that the phone number to call in each commercial is different. This is call tracking in its simplest form, predating the dynamic call tracking that is in use for many digital campaigns today. To see this in action, take a look at two versions of the legendary ShamWow commercial (version 1 | version 2). The content in each video is identical, but the phone number at the end of each video is different. If you call each number, you likely will talk to someone in the same call center - maybe even the same person! This is presumably because the company was placing this ad on many different channels and wanted to measure the effectiveness of each so they could throw more money at the higher-performing channels and stop spending money on the lower-performing channels.

Call Routing or Termination

Another important concept to understand with how call tracking works is routing, or termination. It's likely that each phone number that we saw in the ShamWow commercial actually was being forwarded to the same phone number that is owned by the call center. Your company may only own a single phone number, and there is no way to tell exactly which marketing effort every call comes from if every user dials the same number. However, with a call tracking solution, a marketer has the ability to distinguish calls generated by direct mail from calls generated by any paid search keyword because the number that appears on direct mail will not be the same number that appears on the website after a user clicks on a paid search ad.


Dynamic Call Tracking

To take it a step further, many call tracking platforms have dynamic tracking which assign a unique phone number to a user who makes it to your website. The information on how that user made it to your website is associated with that user, and any call placed to that number within a set period of time is attributed to that user. For example, let's say that you sell tennis lessons on your website, and you've been doing some digital marketing. I could search Google for the word "tennis lessons" and then click on your ad. At the same time, someone could search for "tennis instructor" and then click on your ad. Each of us may see a different phone number on the website, but when we call, we may both end up calling your cell phone because that is where your calls are being routed to. After we both call, you will be able to look in your call tracking platform and see that each of us used a different search keyword to find your website.


Why Your Business Needs Call Tracking

Famous consultant and author Peter Drucker once said "If you can't measure it, you can't improve it." If marketing is important to your business, and your marketing efforts are focused on driving people to pick up the phone to give you their business, then call tracking is a must. Without it, you will not know how effective each marketing channel, campaign, ad, keyword, etc. are performing; therefore you can't measure it, and you can't improve it.


Call Tracking Platforms

Over the years, many call tracking platforms have come and gone. Many have merged or been acquired by larger companies looking to add call tracking as a core competency. Because call tracking is a mature technology, there are many reputable players in the space. Some of the companies you will encounter are:

  • CallRail
  • CallTrackingMetrics
  • Dialogtech (Formerly Ifbyphone which previously acquired Mongooose Metrics)
  • Marchex Call Analytics
  • Invoca
  • Ringba
  • The list goes on…

  • Resources

    There are many great resources for learning about call tracking as well as comparing providers. See below for a few of them:

  • CallRail Blog
  • Dialogtech University
  • CallTrackingMetrics Academy
  • Capterra Call Tracking Software Reviews

  • Engage with Us

    Whether you need help selecting a call tracking provider, or you need help with integrating your current provider with your other systems, we can help! Contact us by emailing info@fusion75.com or filling out the form below.

    How to Invite a User to LinkedIn Ads

    Why would someone need access to my LinkedIn Ads account?

    There are many reasons to give someone access to your LinkedIn Ads account. Some common reasons are below:

    • They could be managing your LinkedIn Ads account for you

    • They could be auditing and restructuring your LinkedIn Ads account

    • They could be setting up conversion tracking for your LinkedIn Ads account

    • They could be uploading first-party or third-party audience data to your LinkedIn Ads account

    • They could be building a dashboard that integrates data from LinkedIn Ads with other marketing data sources.

    Steps for granting access to your LinkedIn Ads Account

    No matter the case, the process for giving access to your LinkedIn Ads account is generally the same. See below for steps:

    Go to LinkedIn Campaign Manager, and select the account you're working on. Click the Gear near the top-right of the browser window and select Manage Access.

    linkedin-ads-manage-access.png

    A User Permissions window will pop up. Click the Edit link in the top-right corner of this window.

    linkedin-ads-user-permissions.png

    Then on the left side of that window, click Add user to account +.


    Then enter the name or LinkedIn profile URL of the user whom you'd like to invite. This person must have a LinkedIn profile.

    linkedin-ads-add-user-profile.png

    Select Account Manager, and then click Save Changes.


    linkedin-ads-add-user-account-manager.jpg

    After this, the invitee will receive an email with a link (and a LinkedIn notification) with instructions on how to access the account.

    That’s it! And if you find yourself needing help with the tracking implementation of your LinkedIn Ads account, or you need automate some reporting that includes LinkedIn Ads data, don’t hesitate to reach out to us!


    How to Invite a User to Facebook Ads

    Why would someone need access to my Facebook Ads account?

    There are many reasons to give someone access to your Facebook Ads account. Some common reasons are below:

    • They could be managing your Facebook Ads account for you

    • They could be auditing and restructuring your Facebook Ads account

    • They could be setting up event tracking for your Facebook Ads account

    • They could be uploading first-party or third-party audience data to your Facebook Ads account

    • They could be building a dashboard that integrates data from Facebook Ads with other marketing data sources.

    Steps for granting access to your Facebook Ads Account

    No matter the case, the process for giving access to an ad account is generally the same. Following Facebook’s own instructions can sometimes be a bit tricky, so we’ve attempted to simplify the steps below:

    Invite a user to work on your business by going to Business Manager Settings >> People and clicking + Add

    facebook-ads-add-people.png


    Enter the user's email address. Make sure Employee access is the option selected and then click Next

    facebook-ads-invite-people.png

    Under Select Assets select the page which will be associated with the ads that will be created. Then under Set Permissions, toggle the slider to the right of Create Ads.

    facebook-ads-assign-access.png


    Under Select Asset Type, select Ad Accounts. Then under Select Assets, select the ad account. Under Set Permissions, select Manage Campaigns, and then click Invite.

    facebook-ads-ad-account-assign-access.png

    After this, the invitee will receive an email with a link (and possibly a Facebook notification if the email address is tied to her Facebook account) and prompts that allows her to accept your invitation.

    That’s it! And if you find yourself needing an audit of your Facebook Ads account, or you need automate some reporting that includes Facebook Ads data, don’t hesitate to reach out to us!


    How to Invite a User to Google Ads

    Why would someone need access to my Google Ads account?

    There are many reasons to give someone access to your Google Ads account. Some common reasons are below:

    • They could be managing your Google Ads account for you

    • They could be auditing and restructuring your Google Ads account

    • They could be setting up conversion tracking for your Google Ads Account

    • They could be building a dashboard that integrates data from Google Ads with other marketing data sources.

    Steps for granting access to your Google Ads Account

    No matter the case, the process for giving access to a single account is generally the same. Follow the steps below:

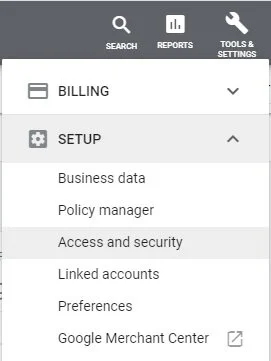
    Log into your Google Ads account and click Tools & Settings.

    google-ads-tools-and-settings

    Under Setup, select Access and security

    google-ads-access-and-security

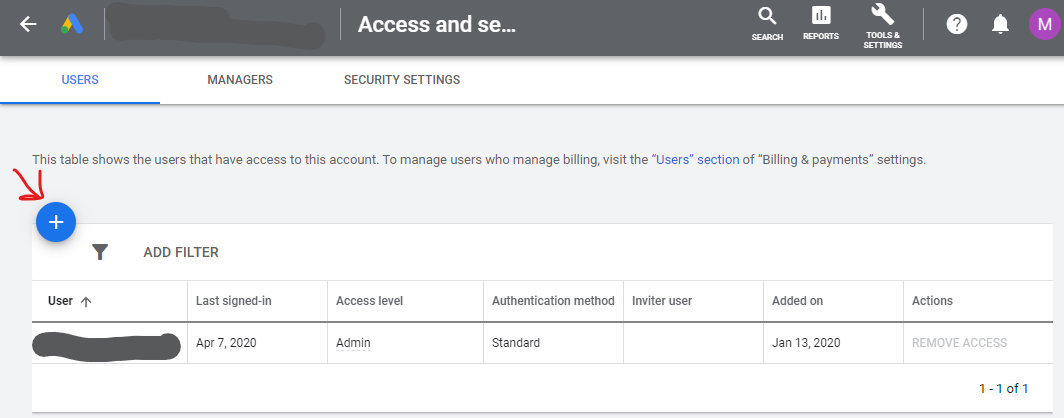
    Click the big blue + to add a user.

    google-ads-add-a-user

    Enter the user's email address and select the correct access level. Standard is most common, but Email Only or Read Only could be appropriate depending on the situation. After selecting the proper access level, click the button that says SEND INVITATION.

    google-ads-invite-user.jpg.png

    After this, the invitee will receive an email with a link and prompts that allows him to accept your invitation.

    That’s it! And if you find yourself needing an audit of your Google Ads account, or you need automate some reporting that includes Google Ads data, don’t hesitate to reach out to us!